We hosted teams from NSPCC and the University of London for a hack day built around one deceptively simple question: What are the five things you should work on next?
We love the moment when a good idea stops being theoretical. Last year, at our Great Digital for Good Conference, we gave delegates something that’s increasingly rare in digital roles: genuine time and space to step back from the day-to-day and think about what would actually make their working lives better.
Two organisations we work with, NSPCC and the University of London, used that space to arrive at a shared insight. What they wanted was deceptively simple: a dashboard that could cut through the noise, pull together information from all the platforms they were already using, and show them clearly “here are the five things you should work on next”.
It was a simple idea. But the best ones usually are. So we offered them a hack day at Numiko HQ to take it further, with our team alongside them to turn the concept into something real.


The challenge: knowing what to do next
Anyone who’s worked in a digital team at a large organisation knows the feeling. You’re logging into Silktide to check accessibility issues, then GA4 for traffic, then to SEMrush or SE Ranking for search engine performance, then heat mapping tools for on-page behaviour, then back to your project management tool to work out what’s actually on your plate for the week.
Everything lives somewhere different. Everything has something for you to be doing. And yet the hardest question, ‘where do I start?’, takes up most of your time.
For the NSPCC, the focus was on foundational reporting needs. With activity spanning digital, content, brand, social, and campaigns, they needed better visibility of their key metrics in one place, with reporting that could be fully automated rather than having to manually pull data from multiple sources each time an update was needed. They also wanted something their teams could easily share with each other, rather than insights sitting with one person.
The University of London had a very similar pain point. They had plenty of data, but it was disconnected, living across platforms that didn’t talk to each other. What they wanted was a single interface that could pull insights together and tell them what to do next, not just what was happening.
From ideas to prototypes
We used Figma to wireframe the user interfaces, getting specific about what the dashboard actually needed to show. Working through the core purpose, the integrations required, and the metrics that mattered most, both teams landed on a focused set of metrics including sessions, new visitors, engagement rate, average engagement time, AI-generated traffic, and direct traffic to their site. Broad enough to be meaningful for both organisations but focused enough to avoid the overwhelm that often comes from too much information at once.
With all of that in hand, we moved into building using Claude Code, to rapidly create working connections to their data. The data was pulled from APIs including GA4, Crazy Egg, Silktide, Google Search Console, and Page Speed Insights. We also used Looker Studio to create visual dashboards for the key metrics, before joining these up with the user interfaces to create working prototypes.
By the end of the afternoon, both teams had something they could actually see and interact with, that was tailored to their organisations’ data.
What we built
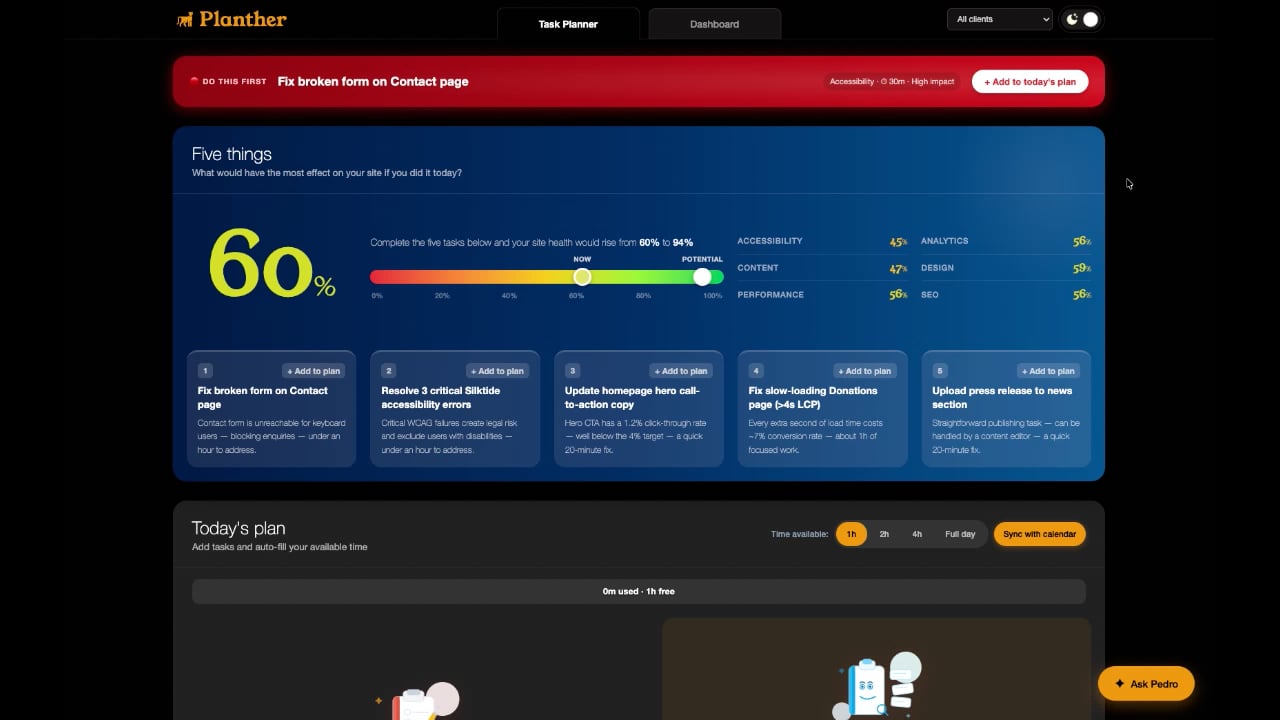
The core output was a working prototype designed to answer that deceptively simple question: what should I work on next?
It has two views: the dashboard and a task planner.
The dashboard pulls live data from the platforms that both organisations already use into a single view, showing key performance metrics and which pages are doing the heavy lifting.
The task planner lets you act on that. Instantly, it shows you the five things that would have the most effect on your site if you did them today and tells you how much your site health would improve as a result. You set how much time you have available for the day and the tool builds a plan around it, drawing tasks from real data sources, categorising them by type (content, accessibility, performance, analytics), and ranking them using an Eisenhower matrix so you can see what’s urgent, what’s important, and what can wait. There’s also a built-in AI assistant who can help you think through your workload and figure out where to start.
What we learned
Start with the problem, not the tool. The morning discovery session was a valuable part of the day. Both teams arrived with assumptions about what they needed. By the time they'd spent a few hours interrogating those assumptions together, the brief had shifted in ways that made the output significantly more useful. Time spent defining the problem is never wasted.
AI works best when it’s solving a well-understood human problem. The task planner worked because we’d spent the morning getting specific about what ‘prioritisation’ actually means for these teams. The technology followed the insight, not the other way around.
A shared problem is easier to solve. Having two organisations in the room working on the same challenge meant that one team’s insight would prompt a rethink from the other. Ideas cross-pollinated in ways that may not have happened if either group had been working alone.
What happens next
Our Great Digital for Good hack day uncovered some exciting opportunities for how purpose-driven organisations can get more from the data they already have.
The prototype built during the day has been formally added to the University of London's digital roadmap, ready for delivery of a production-ready version. What started as a one-day concept is becoming a tool that gives their team genuine, real-time visibility of their digital estate. We're working together to turn it into something that could ultimately help other digital teams facing the same challenge.
NSPCC also have access to the prototype, alongside the Looker Studio reporting foundations laid during the day. Together, these give their team a clearer picture of what automated, shareable reporting could look like, and a working example of how prioritised actions can be surfaced from data they already have.
And for us, this hackday reinforced why we run these events. They're not just about the prototypes. They're about the kind of thinking that happens when you get motivated people in a room together, give them a clear problem, and create the conditions for something new to emerge.
We’re planning more of these. If you have an idea that keeps coming up in team conversations but never quite makes it to the top of the backlog, we’d love to hear from you.
Get in touch and let’s talk about what we could build together.