
Your website generates mountains of data. The real challenge is turning that data into meaningful action that advances your organisation's mission.
Introduction
Digital teams have never had more information at their fingertips. Every click, scroll and conversion can be tracked. Dashboards proliferate. Reports multiply. Yet, this abundance leaves many organisations struggling to translate their analytics into decisions that actually improve outcomes.
Don't start with the data
When faced with a measurement project, the instinct is to begin by asking what we can track. What events can we tag? What metrics does Google Analytics provide? This leads to dashboards crammed with information that tells us everything about activity but little about success.
Consider a call centre that meticulously tracks the number of outgoing calls, average call duration, and even how long agents spend away from their desks. These metrics reveal plenty about what's happening, but almost nothing about whether the call centre is achieving its purpose. A more useful approach would be to focus on why people are calling in the first place, and whether those issues could be resolved before anyone picks up the phone.
The same logic applies to websites, so start with your purpose. What is your organisation actually for? Are you working to connect people with great art, alleviate childhood poverty, advance scientific research or recruit bright applicants? With this goal in mind, you can work backwards to understand what your website should be doing to support it.
This might sound basic, but from experience, these questions often aren't asked at the outset of measurement projects. Getting them right is essential.
Link to real-world outcomes
Your website doesn't exist in isolation. It's a tool to help your organisation achieve its mission in the real world. The metrics that matter most are those that connect digital activity to tangible outcomes: applications submitted, tickets purchased, donations made, volunteers recruited.
The task is to trace the digital journey that leads to each outcome. What engagement has to happen on your website for the real-world event to occur? For example, if you're trying to drive ticket sales, you need to understand the purchase journey and identify where people are dropping off.
This distinction between measuring activity and measuring success is crucial. Activity tells you what people are doing. Success tells you whether what they're doing is moving you closer to your mission. For purpose-driven organisations especially, the point isn't just to generate traffic or boost engagement metrics. It's to create impact.
Let the numbers highlight, let people explain
Quantitative data from your analytics platform is excellent at revealing what is happening. It can show you that visitors are abandoning a particular page, that conversion rates have dropped, or that a section of your site is underperforming. What is cannot tell you is why.
If your analytics show that 60% of visitors leave during the ticket purchase journey, you know there's a problem. But you don't know what's causing it. Is the process too long? Is the pricing unclear? Are people confused by the interface? To answer those questions, you need to speak to real users.
This is where qualitative research becomes indispensable. Interviews, usability testing and focus groups can uncover the motivations, frustrations and misunderstandings that numbers alone cannot reveal. A well-designed dashboard will not only answer questions, but also pose them. It might show you something unexpected is happening and prompt you to investigate further through conversation with the people who use your site.
The most effective measurement strategies combine both approaches. Use quantitative data to identify issues and prioritise where to focus. Then use qualitative methods to understand the underlying causes and inform what you can do to address them.
Using data to make the case for change
Analytics is not just for understanding your current performance. It’s your best tool for building the argument for improvement. Opinions can clash endlessly in meetings, but well-presented data from real users is difficult to dismiss.
The key is to create a framework that connects your data to specific levers you can pull. This means thinking through, in advance, what actions you would take if your metrics told you X or Y.
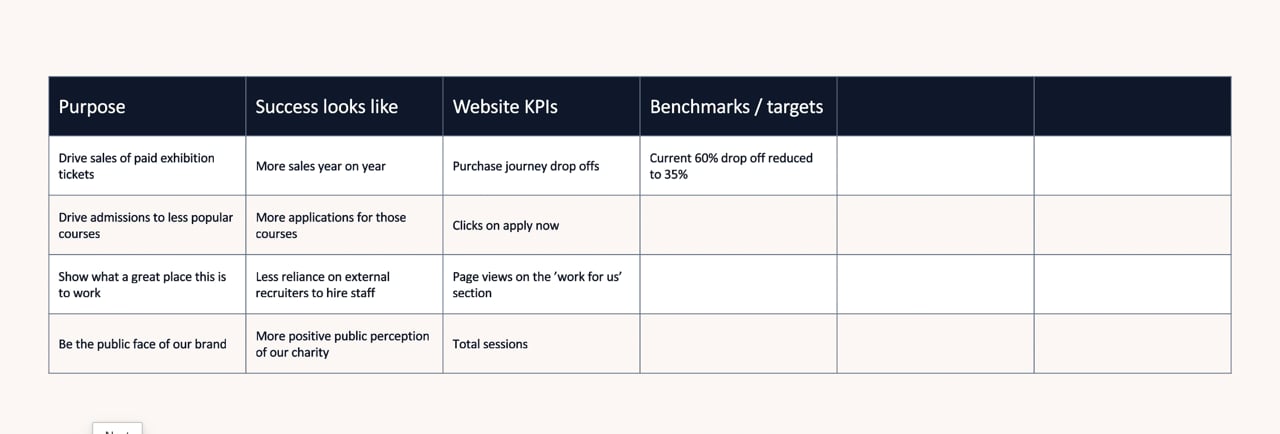
Start by defining what success looks like for each of your website's purposes. If you want to drive more paid exhibition tickets, success might mean fewer drop-offs during the purchase journey. If you want more course applications, it might mean more clicks on the "Apply now" button. Make these definitions numerical and specific. Rather than saying you want "more sales," specify that you want to increase conversion from 5% to 10%.
Then identify benchmarks and targets. Where are you now, and where do you want to be? Benchmarks should account for seasonality and the rhythm of your organisation. A snapshot of last week's performance is less useful than a trend over a longer period. Targets should be linked to cause and effect. If you want to increase ticket sales, the most effective target might not be more traffic at the top of the funnel, but a higher conversion rate further down.
With benchmarks and targets in place, you can then map out what actions would help you reach those goals. Reducing drop-offs in a purchase journey is typically a UX issue. Increasing engagement with a particular section might require content improvements. Driving more traffic could be an outreach challenge involving paid media or search engine optimisation. Each of these actions can be assigned to a responsible party, whether that's your internal team, your web agency, or your marketing department.
This establishes a connecting thread from organisational purpose to specific actions, with data providing the evidence at every stage.
Measure across the funnel
A common mistake is focusing exclusively on the top of the funnel. If sales or applications aren't where you want them, the instinct is often to drive more traffic to the site. But traffic is only part of the equation.
Think of your user journey as a funnel with multiple stages. Visitors arrive at your site. Some explore further. Some reach a key page, like a product listing or an application form. A smaller number take action. At each stage, people drop off.
Understanding the conversion rate at each point reveals where the biggest opportunities lie. If you're losing 60% of visitors before they even reach your booking page, no amount of additional traffic will fix the underlying problem. You'd be pouring water into a leaky bucket. The smarter approach is to focus on the stages with the steepest drop-offs and address the friction causing people to leave.
Increasing your conversion rate from 5% to 10% could generate more value than doubling your traffic. This is why effective measurement looks at the entire journey, not just the entry point.
Review cadence matters
How often you look at your data shapes the kinds of solutions you'll pursue.
If you review a metric weekly, you'll naturally gravitate towards short-term interventions. Need more traffic quickly? Increase your paid advertising spend. Want to boost conversions this week? Run a promotional offer. These tactics have their place, but they rarely address deeper structural issues.
If you review the same metric quarterly or biannually, you create space to think differently. You can consider more substantial interventions like redesigning a user journey, commissioning user research, or overhauling your content strategy. These approaches take longer to implement and longer to show results, but they often deliver more lasting improvements.
Different metrics also warrant different review cadences. Traffic volumes might be worth monitoring monthly, but the success of a major website redesign should be assessed over a longer period. Judging a project too quickly can lead you to abandon an approach before it's had time to take effect.
The rhythm of your review meetings is, in effect, a decision about what kinds of improvements you're willing to make. Build in longer intervals for strategic metrics, and you give yourself permission to think beyond the immediate.
Working across silos
One of the most valuable things a success framework can do is break down organisational silos.
When you trace the line from purpose to success to specific actions, you make visible what different teams need to contribute. The marketing team might be responsible for driving qualified traffic. The web team might own the user experience. The content team might need to improve the clarity of key pages. Each group can see how their work connects to shared goals.
This clarity also helps distinguish between what can be handled internally and what might need external support. If the issue is a UX problem in your booking journey, you might need your web agency. If the issue is low findability in search results, you might need SEO expertise. If the issue is that visitors don't understand your offer, you might need to revisit your messaging.
A shared success framework gives everyone a common language. Instead of each department optimising for their own metrics in isolation, the whole organisation can align around what really matters.
Making it work
The shift from passive reporting to active decision-making requires discipline. It means resisting the temptation to fill dashboards with every available metric and instead focusing on what you genuinely need to know. It means asking not just what happened, but why it happened and what you're going to do about it. And it means creating feedback loops where insights lead to action and action leads to measurable change.
The key thing to always have in mind is that data is a means to an end. The goal isn't a prettier dashboard or a more comprehensive report. The goal is to create real-world change that advances your mission. Every metric you track, every benchmark you set, and every target you pursue should be in service of that larger purpose.
Analytics done well is about surfacing the insights that matter, connecting them to actions that make a difference, and building momentum across your organisation. If you’d like help building your own success framework to use your data to drive meaningful outcomes, we’d love to have a chat about how we can help.
